Sensitivity Analysis in Supply Chain Design and Planning

Optimization, by definition, provides the single best answer given a prescribed set of inputs and a specific objective. The power of algorithms makes it easy to return an optimal answer to a relatively complex problem. For instance, network optimization is a fantastic tool for providing the best product flow to maximize profit for a multi-echelon supply chain where conditions such as demand, supply, transportation and labor rates, and facility operating costs are known. In this sense, network optimization is deterministic in its assumptions about the future state of the environment.
However, we operate in a complex economy without perfect information. Markets shift and costs fluctuate. This does not mean we should throw up our hands and say “No analysis!” In fact, it is quite the opposite. Today’s complex and dynamic business environment demands more than business intuition alone. Instead, we should respect the unknown and accommodate our analysis accordingly. We must treat reality as stochastic or uncertain. As Borges reminds us, “Nothing is built on stone; all is built on sand, but we must build as if the sand were stone.”
Despite the intentions and rigor of forecasting and budgeting, planning is seldom an exact match with actual. Moreover, a solution which is optimal under certain circumstances could be suboptimal under even slightly different conditions. As an example, the multiple raw materials required for manufacturing a finished product may have varying discount levels subject to purchase quantities. As such, forecasts may impact supplier selection, transport mode decisions, order quantities, and many ‘downstream’ decisions. The question now becomes, how accurate is the demand planning for the finished product? Demand forecasting is only one important variable; we should not neglect the impact of externalities, including so-called “black swan” events (e.g. Brexit) or localized events (e.g. port congestion or unplanned machine downtime), on elements such as cost and material flow.
Applying Sensitivity Analysis in Supply Chain Design and Planning
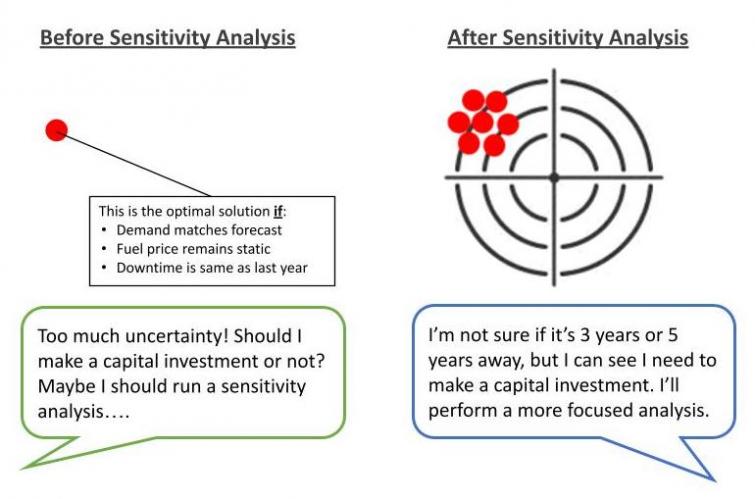
Algorithms and software are quite good at performing explicitly what the analyst requests; however, the analyst must be certain to interrogate the model with the proper questions. When the stakes of decision-making are high, it is important to understand the sensitivity of a solution to any input variables which are unknown or subject to change.
In network optimization for supply chain planning, sensitivity analysis should be applied to variables which have some uncertainty due to volatility (e.g. demand), tie to key assumptions in the model (e.g. production yield), or are subject to externalities (e.g. fuel price). These are only broad examples; specific considerations will be relevant to each industry and firm.
Scenario management readily facilitates the intentional varying of prescribed inputs to evaluate and compare resultant outputs. Analyzing multiple scenarios enables understanding of sensitivity of outputs to certain inputs. As a simple example, as part of a capital budgeting analysis, prudent scenario planning would run scenarios for optimistic, realistic, and pessimistic thresholds of demand to determine whether the expense is justified.
For an even more thorough validation of network design and policies, you can apply simulation to a network model, such as that provided by a digital supply chain twin. Simulation runs multiple replications while sampling predefined probability distributions for any components of the network where variability is important to consider. For instance, probability distributions could be applied to demand quantities, transport cost, lead times, and production yield to better understand the cumulative effect of variability on the network.
Identifying Robust Solutions for Decision-Making Under Uncertainty
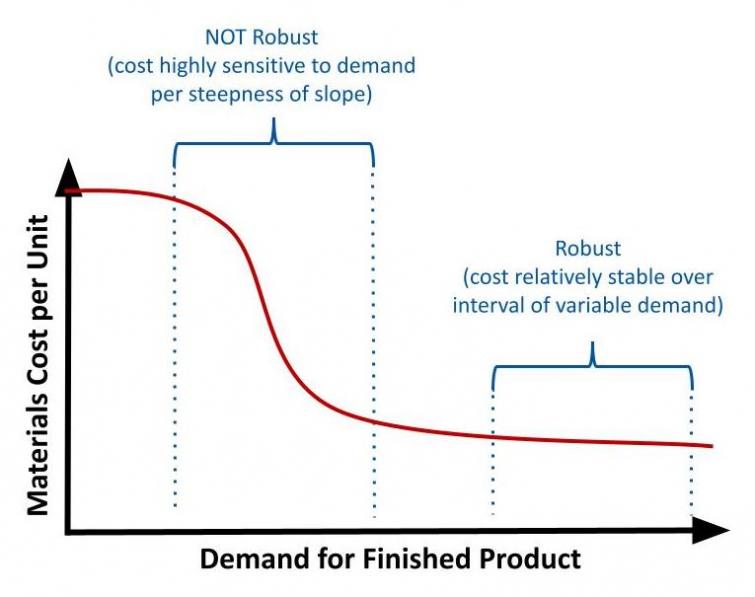
When the sensitivity of a solution to certain variables is understood, its robustness can be determined. Robust solutions have the greatest probability of performance (e.g. cost minimization) across a spectrum of various inputs. This can also be thought of as the slope of a line of single best answers, given different inputs. In fact, the key metrics from scenario output can be graphed in precisely this manner. The shape of the resulting solution curve tells a story which can provide rich insight into robustness, trade-offs, and ‘best value’ during the supply chain decision-making process.
While optimization as a tool provides the single best answer, our implicit obligation to our stakeholders should be to identify robust solutions under uncertain conditions to enable a better decision-making process. While providing multiple scenarios and answers seemingly puts the burden back on the decision-makers, it in fact equips them with a deeper and multi-dimensional understanding of the potential implications of that decision. This is the harmony between powerful software and adept business analysis!
We’ve looked at how Coupa’s Supply Chain Design & Planning solution can help companies visualize and anticipate scenarios that can affect performance. By identifying potential outcomes of given inputs through supply chain analytics, a company can increase the speed, accuracy, and flexibility in which it responds to change.