Drive smarter spend strategies with AI
See what exceptional performance looks like and learn how to close the gaps.
Get the Benchmark Report




Coupa Named a Leader in the 2026 IDC MarketScape Worldwide AI-Enabled Direct Spend

Transaction data following the Strait of Hormuz disruption shows an uneven purchasing recovery, persistent freight inflation, and U.S. buyers lack a clear solution.
From the Coupa Spend Lab. Analysis of purchase order and invoice activity across the Coupa platform, January 2025 through July 2026.
Conflict upended business in the Strait of Hormuz on Feb. 28, 2026. Six months later, supply chain disruption continues, the orders are down again, and the bill for moving anything is still rising. Two numbers tell an interesting story: the price of a barrel of oil and the cost of moving a container. Both are set by traders pricing in what they expect next. Neither one tells a company whether its own costs have come back down.
The recovery wasn’t really a recovery.
That 9.2% freight reading comes five months after the initial shock, and weeks after purchasing in the region had already recovered to its earlier pace. Any company that watched the orders come back and marked the disruption closed is planning against the wrong number.
Coupa can see that because more than $10.5 trillion in business spend has run through our platform, recorded as companies commit it. A purchase order names a supplier, carries a date, fixes a price and obligates money. An invoice is the bill that follows. Neither one is a forecast.
Together they show what companies bought and what they were charged after the sea lane destabilized, in the same anonymized and aggregated view behind the Coupa Business Spend Index.
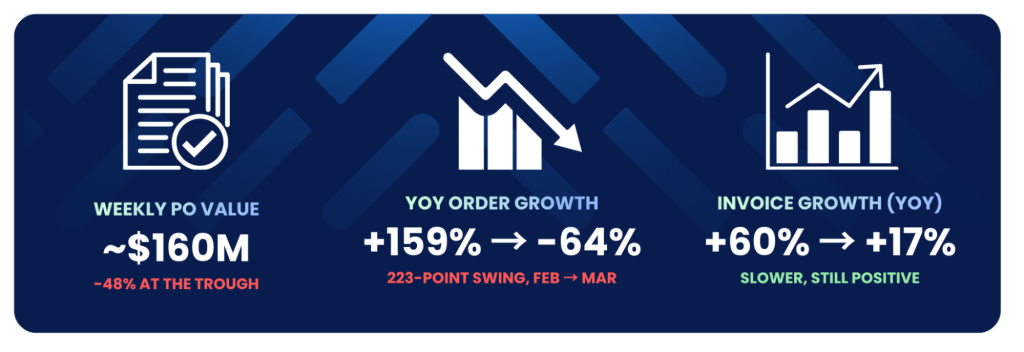
Among businesses billed in the Middle East and North Africa, weekly purchase order value fell about 48% at the trough, from a pre-disruption run rate of roughly $160 million a week. Year-over-year order growth for that group went from 159% in February to negative 64% in March. The swing is the signal there, since growth rates in this series also reflect a widening set of companies on the platform. Invoice growth over the same two months slowed from 60% to 17%, which still reads as growth.
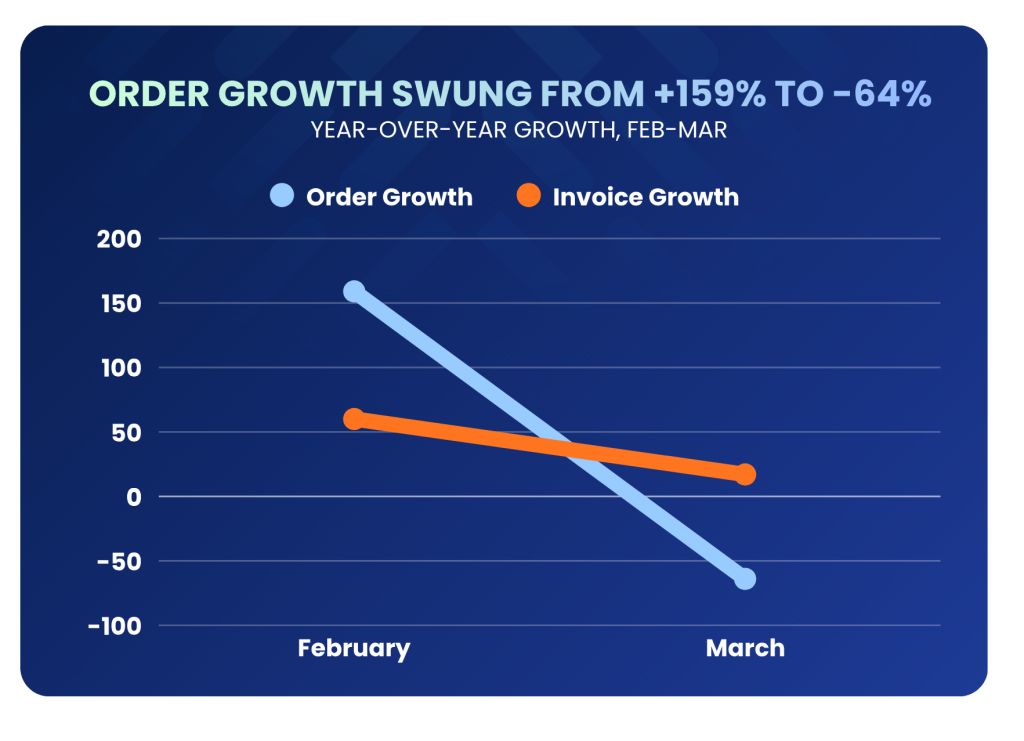
The gap between those two series is the operationally useful part. Invoices arrive after goods ship and services are delivered, so they describe decisions made weeks earlier. Purchase orders move when the decision moves. A company watching only its payables in March would have seen business softening. Its commitments had already stopped.
Weekly order value for those buyers returned to its pre-disruption run rate roughly 13 weeks after Feb. 28, which lands at the end of May. They found other routes, other suppliers, other terms, and got back to ordering while transport challenges persist. From mid-June the line slipped below that run rate again.
Then July.
Order and invoice value for buyers in the region were both down 31% year over year. Order value flowing to suppliers domiciled in the region, from buyers anywhere in the world, was down 35%. The ceasefire collapsed on July 7, so July is not a clean fifth month of recovery.
Read that as a weakening against pre-destabilization averages rather than a return to March conditions, since order value did not fall anywhere near as far as it did in the first month. July invoice figures do remain preliminary, because of the lag between a transaction and its appearance in the data.
In matched price data, inflation in the freight and logistics industry reached 9.2% year over year in July, the highest reading since the disruption, and still accelerating. Those prices had been flat or falling through most of 2025. Chemicals went the other way, peaking at 8.5% in May and easing to 3.1% by July. Freight is the one series still heading the wrong way.
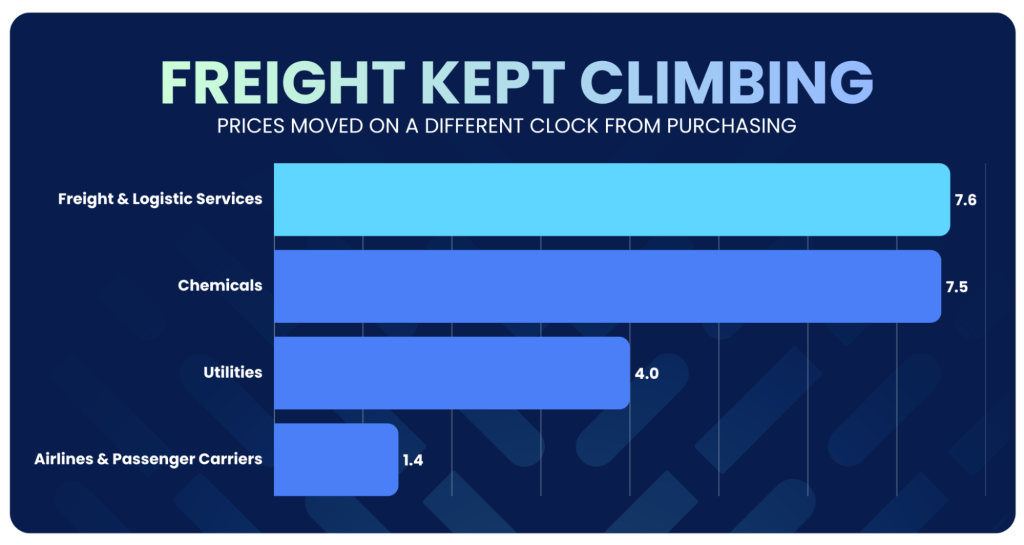
The analysis holds the buyer, the supplier, the commodity, and the unit of measure constant over time, which strips out changes in what companies bought and isolates what they paid.
A note on what this is and is not. Freight and logistics activity did not dry up after February, so this is not higher prices on a thinner book of business. And the price rise tracks the oil shock rather than the pullback in purchasing, which is why the two can move independently.
Among U.S. companies already buying from suppliers in the region before the destabilization, the median buyer cut purchase order value by about 23% over the five months after, and by 34% in July alone, and that cut was specific to the region. The same buyers held roughly flat everywhere else. Inside the group, 39% raised their Middle East orders and 47% raised invoicing, so a sizable minority leaned in while the typical buyer pulled back.
Then look at the total. Order value from North American buyers to suppliers in the region rose 65%, an increase of roughly $460 million, lifted by a small number of very large goods and services buyers.
Both figures are real, and they are drawn from different populations. The 65% covers all spend from U.S. buyers to Middle East suppliers, including companies that had no such supplier relationship before February. It is not one cohort behaving one way individually and another way in aggregate.
What the pairing establishes is concentration. A handful of large American buyers carries enough order value to make the bilateral U.S. to Middle East total look healthy while the typical returning buyer cut by roughly a quarter — this may indicate a “K-shaped” style recovery. The picture for suppliers in the region is not healthy on its own terms. Order value reaching them contracted, and both orders and invoices decelerated.
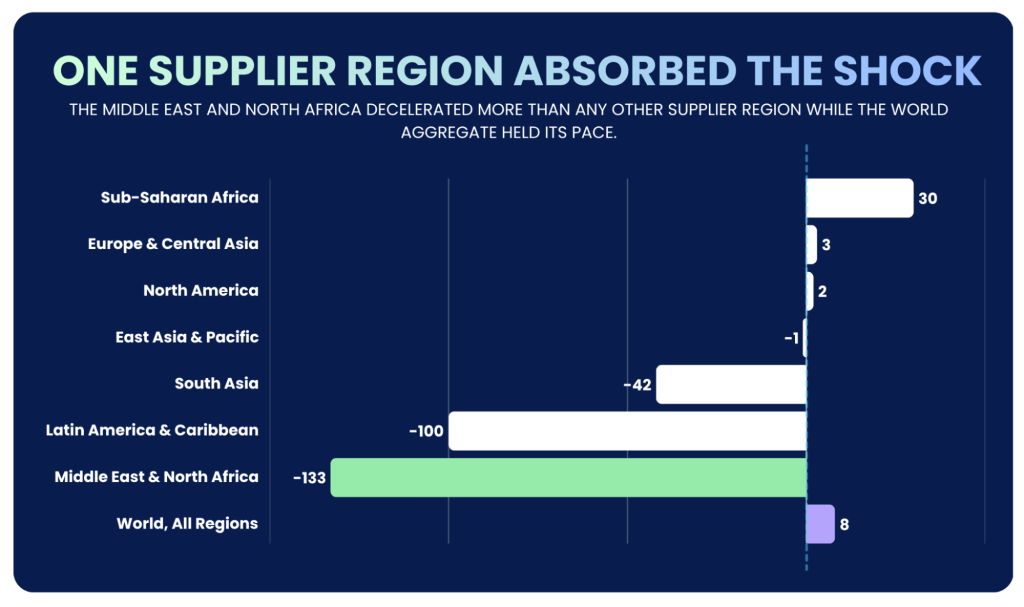
Against its own pre-disruption pace, purchase order growth for Middle East and North African suppliers swung down 133 percentage points. The world aggregate moved 8 points the other way. That is the steepest deceleration of any supplier region in the data, and it sits next to a global figure that barely moved. The disruption concentrated in one region while purchasing elsewhere held its pace.
The buyers most exposed to the region cut rather than rerouted. Cohorts with the heaviest pre-disruption Middle East sourcing reduced total order value by 19% to 31% and barely changed their supplier mix. Those cohorts are small, and are treated as directional.
Three things worth carrying into the next disruption.
The regional customer analysis covers 20 customers, representing 1,489,495 invoices worth $9.47 billion and 1,184,017 purchase orders worth $10.28 billion. The regional supplier analysis covers 589 customer instances that sourced from a Middle East supplier within the window, representing 1,280,230 invoices worth $16.05 billion and 943,046 purchase orders worth $11.57 billion. The North American flows to Middle East suppliers cover 378 customers. The median U.S. buyer analysis covers 234 customers on purchase orders and 282 on invoices. The price analysis is not a fixed panel and coverage varies by month, reported per series, with any series month below five contributing companies suppressed. Freight and logistics draws on 23 to 26 companies, chemicals on 27 to 35.
North American flows to Middle East suppliers cover $9.43 billion from March 2025 to July 2026, being $6.11 billion in invoices and $3.32 billion in purchase orders. The median U.S. buyer analysis covers $10.48 billion from January 2025 to July 2026, being $6.79 billion in invoices and $3.69 billion in purchase orders. Middle East and North Africa uses the World Bank grouping and covers 23 countries. North America covers the United States, Canada, and Mexico, being 1,510 customer instances, of which 1,406 are U.S., 69 Canadian, and 35 Mexican.
The same panel is not used throughout, and the comparison window differs by finding. Due to the short measurement period, this does not meaningfully impact the comparability of the data. Weekly run rate comparisons use November 2025 to February 2026 against March to July 2026. Year-over-year series for regional customers, regional suppliers, prices, and the median U.S. buyer use January 2025 to February 2026 as the pre-period, with 2024 data included to compute the rates, against March to July 2026. Supplier region swings and North American flows use March to July 2025 against the same months of 2026. Each analysis includes all qualifying companies as of the September 2026 data pull rather than a locked panel. The median U.S. buyer analysis includes only companies with a non-zero base in the comparison month.
All figures are in U.S. dollars, converted upstream of this analysis. Transactions above $50 million are excluded from the source data. Most findings were run on both a balanced and an unbalanced panel and the results did not differ materially, so the unbalanced version is reported. The source data contains current customers only, which removes departures from the sample, leaving new companies joining mid-period as the main composition risk.
Prices are a chained Törnqvist index of unit values, taken as invoice or purchase order line value divided by quantity, measured within buyer, supplier, commodity, and unit cells and aggregated by expenditure share. Holding the cell constant is what separates a change in price from a change in what was bought.
Invoice data is expected to settle within roughly 2% of its final value two to three months after a transaction. This extract was pulled in the first week of September, so July invoice figures may be understated and are preliminary. Purchase order figures for July are stable.
For deeper context around this data or technical questions, please reach out to [email protected] for more details.
Oh! It looks like you opted out from using the needed cookies. If you are interested in using the AI Agent, then please opt-in to the cookies in the preference center.
Update preferences